
International Economics, Trade policy and tariffs: part 18 of 34
A free trade agreement (FTA) is a treaty in which two or more countries remove tariffs and most other barriers on the goods and services they trade with each other, while each keeps its own tariffs and rules for everyone else. The best-known North American example, NAFTA, took effect in 1994 and was replaced by the USMCA in 2020.
This page explains what an FTA does and does not do, how it differs from a customs union, what the evidence on NAFTA shows, what the USMCA changed in the auto sector, why a joint review falls due in 2026, and how the EU, CPTPP and RCEP compare. One stylized example, a country importing washing machines, carries the economics from start to finish. By the end you should be able to judge whether a given agreement is likely to raise a country’s income or mostly redirect its trade.
What a Free Trade Agreement Does
A free trade agreement makes trade cheaper among its members by phasing out tariffs and reducing other barriers, and it does nothing for outsiders. That is the whole design: the lower tariff applies to a Mexican-made part entering the United States, not to the same part made in China.
Tariff elimination is usually phased in. NAFTA removed tariffs on most goods within ten years and finished with the most sensitive farm products in 2008. Modern agreements cover far more than tariffs. They add rules on services, investment, intellectual property, government procurement, customs procedures, product standards, and labor and environmental protection, because non-tariff barriers can block trade as effectively as a tax at the border.
Because members get better treatment than outsiders, an FTA is deliberate discrimination. It is an exception to the most favored nation principle, and GATT Article XXIV permits it only if the agreement covers “substantially all the trade” between the parties and does not raise barriers against everyone else. Each agreement also has its own dispute settlement procedure, usually panels that hear one member’s complaint against another.
Free Trade Agreement vs Customs Union
The difference is the external tariff: in a free trade agreement each member sets its own tariff on outside countries, while in a customs union the members share one common external tariff.
The reason this matters is trade deflection. Suppose, hypothetically, that Canada charges 5 percent on an imported part and Mexico charges 20 percent. If the two formed an FTA with no origin test, the part would enter through Canada and travel duty free to Mexico, and Mexico’s tariff would mean nothing. Members of an FTA therefore need rules of origin, covered below, and customs paperwork to prove where a good was made. Canada and Mexico did keep different tariffs on goods from outside North America, which is why NAFTA needed such rules.
A customs union avoids the problem by giving every member the same external tariff, so a good needs no origin test once it has paid duty at the common border. The cost is independence: members can no longer set their own tariff, and they must negotiate trade deals with outsiders jointly. The European Union is the standard example. Further steps up the ladder, a common market and an economic union, are covered in The Forms of Economic Integration, and the mechanics of origin rules are in Rules of Origin and Trade Deflection.
Bilateral, Regional and Multilateral Free Trade Agreements
A bilateral agreement has two parties, a regional agreement among a handful of countries is often called plurilateral, and a multilateral agreement involves many countries and, in the strict sense, the whole trading system.
The US–Israel agreement of 1985 and the US–Korea agreement (KORUS), in force since 2012, are bilateral. The USMCA, CPTPP and RCEP each have three or more parties and are loosely called multilateral in everyday speech. In trade law, a multilateral agreement means rules accepted by the membership of the World Trade Organization, which stood at 166 members after 2024, and its concessions apply to every member under the most favored nation rule.
Each form has a price. Bilateral deals are faster to negotiate and can go deeper on digital trade or labor, but they have real disadvantages. They create overlapping rulebooks, which Jagdish Bhagwati called the “spaghetti bowl.” They raise the risk of diverting trade, they leave the smaller partner with less bargaining power, and they burden firms that must work out which origin rule applies to which market. Multilateral deals reach everyone and avoid diversion, but they are slow: the WTO’s Doha Round, launched in 2001, has never been completed. The full comparison is in Bilateral vs Multilateral Trade Agreements.
A Worked Example: Home, Partner and Washing Machines
A free trade agreement helps a country when the extra trade it creates is worth more than the cost of buying from a partner that is less efficient than the outside supplier it replaces. A stylized case shows both halves of that sentence, and we will reuse it for the rest of the page.
Home imports washing machines. Measure quantity in thousands of machines and price in dollars. Home’s demand is \(Q_d = 1{,}000 – P\) and its own producers supply \(Q_s = P – 300\). A producer in the rest of the world, call it Outside, can deliver machines at $400, and a producer in Partner can deliver them at $410. Home charges a 20 percent tariff on machines from every country. Assume foreign suppliers can sell any amount at those prices and ignore transport costs.
Before any agreement, an Outside machine costs Home buyers $400 × 1.2 = $480, and a Partner machine would cost $492. Outside wins. At $480, Home consumers buy 520 thousand machines, Home producers make 180 thousand, and the 340 thousand difference is imported. The tariff raises 340 thousand × $80 = $27.2 million.
Now Home and Partner sign a free trade agreement. Partner machines enter duty free at $410, which beats $480, so Partner takes the entire import market. The price in Home falls to $410, consumption rises to 590 thousand, Home output falls to 110 thousand, and imports rise to 480 thousand, all from Partner. Tariff revenue drops to zero, because no machine pays the tariff any more.
Figure 1. Home’s washing machine market before and after the agreement
Add up the three groups. Consumers gain $70 × 555 thousand (the average of 520 and 590) = $38.85 million. Producers lose $70 × 145 thousand (the average of 180 and 110) = $10.15 million. The government loses $27.2 million of revenue. The net effect is $38.85 − $10.15 − $27.2 = +$1.5 million. The same total splits into two named pieces, which Jacob Viner distinguished in 1950:
\( \Delta W = \underbrace{4.9}_{\text{trade creation}} – \underbrace{3.4}_{\text{trade diversion}} = +1.5 \text{ million dollars} \)
Trade creation is the 70 thousand machines that Home consumers newly buy and the 70 thousand that Home producers stop making, both replaced by cheaper imports: two small triangles worth $2.45 million each. Trade diversion is the 340 thousand machines Home already imported, which now come from Partner at $410 instead of Outside at $400, a waste of $10 on each. The page on trade creation and trade diversion develops the framework further.
A $1.5 million gain looks comfortable, but it is fragile. Raise Partner’s price to $450 and the same calculation gives a net loss of $16.1 million. Writing \(x\) for Partner’s cost premium over Outside, in dollars, the creation gain is \((80 – x)^2\) thousand dollars and the diversion loss is \(340x\) thousand dollars. Setting them equal gives a break-even premium of \(x \approx 13\), which means Partner can be only about 3 percent more costly than Outside before Home is worse off.
Figure 2. Trade creation gain against trade diversion loss as Partner’s cost rises

The intuition is that Home gives up tariff revenue on every machine it keeps importing, while the gain from new trade shrinks as the partner becomes less efficient. An agreement is likelier to help when the partner’s costs are close to the world’s lowest, and when the partners already trade heavily with each other, so that most of the trade is new rather than redirected.
Rules of Origin: Who Gets the Tariff Cut
Rules of origin decide which goods qualify for the free-trade tariff rate, and they are where much of the real bargaining in a free trade agreement happens.
Three tests are common. A good may be wholly obtained in the region, such as milk from a farm. It may undergo a tariff shift, meaning its inputs fall under different tariff headings from the finished product. Or it must meet a regional value content (RVC) threshold, meaning a minimum share of its value must come from member countries.
Return to the washing machine. Suppose a Partner factory sells a machine for $410 and imports $120 of motors and electronics from Outside. Regional content is ($410 − $120) / $410 = 70.7 percent. Under a 62.5 percent threshold the machine qualifies for duty-free entry into Home. Under a 75 percent threshold it does not, and the factory must either buy more parts inside the region or sell into Home at the full tariff. Real formulas, based on transaction value or net cost, are more detailed than this simple share, but the logic is the same.
Figure 3. Regional content against two thresholds for a $410 washing machine
Origin rules cut both ways. A tight rule pushes producers toward regional inputs, which is a form of trade diversion in parts, and it adds compliance cost. When the gap between the ordinary (most favored nation) tariff and the preferential rate is small, the paperwork can cost more than the saving, and firms simply skip the preference. When the gap is large, they redesign supply chains to qualify. This is the key to understanding what the USMCA did to autos.
NAFTA, 1994 to 2020: What It Did and What the Evidence Shows
NAFTA, in force from January 1, 1994 among Canada, Mexico and the United States, raised trade among the three sharply, but its effect on overall income was small and its effects on particular workers and regions were uneven.
NAFTA built on the 1989 Canada–US agreement and added Mexico after negotiations that ended in 1992. Side agreements on labor and the environment were attached in 1993 to win ratification. Beyond tariffs, it protected investors through arbitration rules and set standards on intellectual property. Tariffs on most goods fell to zero within ten years, and the last cuts, on sensitive farm goods, finished in 2008.
Trade among the partners grew far faster than their incomes, and production became integrated across borders. Vehicle parts, in particular, can cross the US–Mexico border more than once before a car is finished. By 2023 Mexico had overtaken China as the largest source of US goods imports. This is the pattern the washing machine example predicts for any agreement: partner trade always rises, so the rise alone does not tell you whether it was created or diverted.
The studies that try to answer that question find modest aggregate effects. The Congressional Research Service judged the net effect on the US economy to be relatively small, largely because trade with Canada and Mexico was a modest share of US output. In a widely cited structural estimate, Lorenzo Caliendo and Fernando Parro (2015) found that the tariff cuts raised Mexico’s real income by a bit more than 1 percent, the United States’ by less than a tenth of 1 percent, and Canada’s by almost nothing. The costs fell on narrower groups. Gordon Hanson and coauthors, and separately Hakobyan and McLaren (2016), found sizable wage losses for blue-collar workers in the local labor markets most exposed to the tariff cuts, while some Mexican farmers faced new competition from US imports. A small national gain with concentrated local losses is exactly what the theory predicts, and it is why the political fight never matched the size of the aggregate numbers.
The supply chains that NAFTA encouraged are also the reason the agreement is relevant to nearshoring decisions today.
USMCA: What Changed in 2020 and What the 2026 Review Decides
The USMCA, in force since July 1, 2020, kept NAFTA’s zero-tariff structure for most goods but tightened the rules for autos, added a wage-based labor requirement, and built in a review that can shorten the agreement’s life.
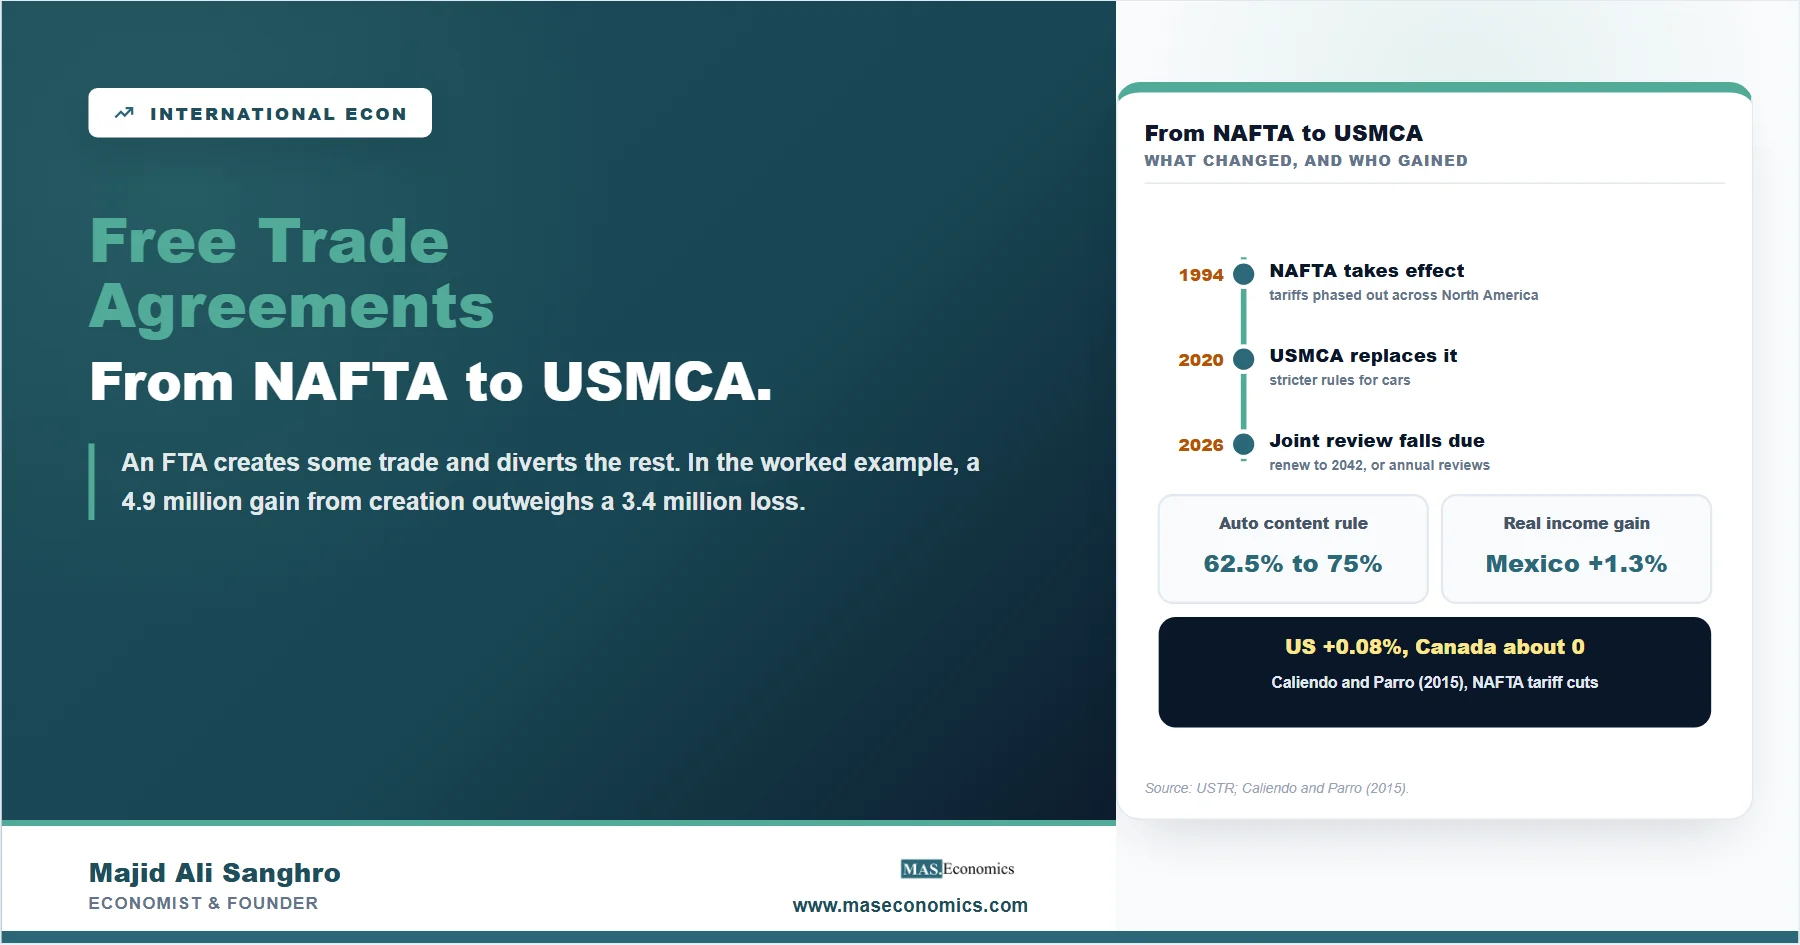
The infographic traces the agreement from NAFTA to the 2026 review, with the tighter auto content rule and the estimated real income gains from the original tariff cuts.
Infographic. From NAFTA to USMCA
Talks to replace NAFTA began in 2017. The three governments signed the USMCA on November 30, 2018, and an amended protocol followed in December 2019. The auto chapter is the most consequential change. The regional value content for passenger vehicles and light trucks rose from 62.5 percent under NAFTA to 75 percent, phased in over three years, the thresholds in Figure 3. Producers must also buy at least 70 percent of their steel and aluminum from North American sources. A new labor value content rule requires that 40 percent of a passenger vehicle’s value (45 percent for light trucks) come from plants where workers earn at least $16 an hour, a requirement aimed mainly at shifting production toward higher-wage countries.
Whether producers comply depends on the preference margin, as the washing machine example suggests. The US most favored nation tariff on passenger cars is 2.5 percent, so a producer facing costly compliance can weigh the paperwork against a small saving. On light trucks the US rate is 25 percent, so the incentive to meet the rules is large. Other changes included greater dairy access to the Canadian market, a facility-level labor enforcement mechanism for Mexico, a digital trade chapter covering cross-border data flows, and a narrowing of investor-state arbitration.
The agreement also contains a sunset clause. On the sixth anniversary, July 1, 2026, the three parties must hold a joint review, and each must confirm in writing whether it wishes to extend the agreement for another 16 years. If all three confirm, the term runs to 2042. If any does not, annual reviews follow and the agreement expires in 2036 unless extended. The review therefore turns every renewal into a negotiation, and the uncertainty raises the cost of long-lived factory investment. Starting in 2025 the United States also imposed additional tariffs on goods from Canada and Mexico, with goods meeting USMCA origin rules generally treated more favorably than those that did not. That treatment shows why origin compliance matters: the preference is only as valuable as the tariff it saves. What the parties decide at and after the review matters more than the date, so check the latest official statements from all three governments.
Other Major Agreements: EU, CPTPP and RCEP
The EU, CPTPP and RCEP show three different designs: a customs union with a single market, a deep agreement among Pacific economies, and a broad agreement across Asia and Oceania built around shared origin rules.
The European Union has a common external tariff and a single market in which goods, services, capital and people move freely, so it sits above a free trade agreement on the integration ladder. Because the Union negotiates as one bloc, its agreements with outsiders, such as the one with Canada (CETA, provisionally applied since 2017) and with Japan (in force since 2019), are FTAs from the outsider’s point of view.
The Comprehensive and Progressive Agreement for Trans-Pacific Partnership (CPTPP) entered into force on December 30, 2018 among 11 economies, after the United States withdrew from its predecessor in January 2017. The United Kingdom joined in December 2024. It is a deep agreement, with rules on services, digital trade, state-owned enterprises and labor.
The Regional Comprehensive Economic Partnership (RCEP), in force since January 1, 2022, links the ten ASEAN members with China, Japan, South Korea, Australia and New Zealand, covering roughly 30 percent of world GDP and population. Its commitments are shallower than CPTPP’s, but one origin rulebook applies across all 15 members, so a part made in one member counts toward the content requirement in another. That cumulation directly answers the spaghetti bowl problem.
| Agreement | Type | In force | Members | What stands out |
|---|---|---|---|---|
| NAFTA | Free trade agreement | 1994 (replaced 2020) | Canada, Mexico, United States | Most tariffs gone by 2008; investor-state arbitration |
| USMCA | Free trade agreement | July 1, 2020 | Canada, Mexico, United States | 75% auto content rule, wage-based labor value content, 2026 joint review |
| European Union | Customs union and single market | 1958 (customs union completed 1968) | 27 member states | Common external tariff, free movement |
| CPTPP | Free trade agreement | December 30, 2018 | 12 economies, including the UK from 2024 | Deep rules on services, digital trade, state-owned enterprises |
| RCEP | Free trade agreement | January 1, 2022 | 15 Asia-Pacific economies | One origin rulebook across the region, shallower commitments |
| AfCFTA | Continental free trade area | May 30, 2019 (trading from 2021) | Most African Union states | Largest by number of member countries |
What a Free Trade Agreement Cannot Do
A free trade agreement cannot guarantee a net gain, cannot spread its gains evenly, and cannot remove every barrier it covers. Figure 2 shows the first limit: when the partner’s costs sit well above the world’s lowest, diversion can outweigh creation. The second limit is distribution. The consumers who gain are many and each gains a little, while the workers who lose are few and each loses a lot, so adjustment costs are real even when the national total is positive.
An FTA also leaves some tools intact. Members can still use anti-dumping duties, countervailing duties and safeguards, though NAFTA and the USMCA added binational panels to review those decisions. Standards, subsidies and procurement rules can keep markets closed. Preferences erode as ordinary tariffs fall, and political decisions can overlay an agreement with new tariffs, as the 2025 episode showed. One misreading is worth avoiding: a bilateral trade deficit with a partner after an agreement says little about whether the agreement worked, because trade balances reflect national saving and investment.
Conclusion
A free trade agreement is a preferential deal, not free trade. It removes barriers among members while leaving outsiders where they were, which is why it can either create new trade or merely redirect existing trade. The washing machine example shows how narrow the margin can be: with a 20 percent tariff, a partner only 3 percent less efficient than the world’s best already turns the net gain into a loss.
NAFTA fits that picture. It raised partner trade and integrated supply chains, with small aggregate income gains and concentrated local costs. The USMCA kept the structure and tightened the origin and wage rules, then placed the whole arrangement under a review that makes its future conditional. The EU, CPTPP and RCEP show that “free trade agreement” covers very different designs, from shared tariffs to shared origin rulebooks.
To judge any agreement, ask five questions. How close is the partner to the world’s lowest-cost supplier? How much did the members already trade? What do the origin rules require? How large is the margin over the ordinary tariff? Who bears the adjustment? The broader trends that shape these answers are discussed in The Future of Trade.
Nuoroda į informacijos šaltinį